A
model which has been "validated," according to the criteria described
in
another chapter,
and which therefore shows:
- a reasonable agreement between
observed and calculated structure factors,
- bond distances, bond angles and
torsional angles that meet stereochemical criteria, and
- physically reasonable thermal
vibration factors
is a reliable model. However, the
concept of
reliability is not a quantitative magnitude which can be written in
terms of a single number. Therefore, to interpret a structural model up
to its logical consequences one has to bear in mind that it is just a
simplified representation, extracted from an electron density function:
in which the atoms have been located and which is being affected by
several conditions (see below)...
Regardless of the subjects included below, the experienced reader
should also consult the contents of the comments included in the
following articles:
The advanced reader, with
interest in macromolecular crystallography, should also have a look to
the results published in Nature
(2016) 530, 202-206.
This article shows that, in addition to the coherent diffraction (Bragg
peaks), the diffraction patterns can display additional information in
the form of continuous diffraction, very useful, among others, to
increase the degree of resolution of the model. A
brief summary of the article can be found through this link.
The effect of resolution
For instance, we must take into account the effect of the resolution
level of the electron density function. The value
that ρ(xyz) displays in each point in the unit cell
is dependent on the sum of all
structure factors
(the waves diffracted by the atoms
contained in the unit cell). Therefore, the amount of structure factors
used in the sum, and their degree of observability, is an important
aspect in obtaining a realistic value of the electron density
at
each point. The degree of precision (resolution level) of an electron
density map is defined as the inverse of the distance that we would be
able to "see" in the map, which is dependent on the radiation
wavelength (λ) and on the maximum detection
angle (θ). The minimum value of the "visible"
distance (known as the resolution level, although actually is the
inverse of the resolution
level) can
deduced from Bragg's Law:
λ / 2.sen θmax
Minimum "visible"
distance in an electron density map (also known
as resolution)
It seems obvious, therefore, that to
obtain a high resolution map (to see fine details of the
structure), we will need to use a small wavelength (small numerator)
and
to get diffraction data (structure factors) up to high diffraction
angles (large denominator).
For crystals of low structural complexity, the number
of structure factors available through a diffraction
experiment is usually sufficient to
obtain realistic values of ρ(xyz), and
thus the map permits us to see structural details at high resolution
(0.5
Angstroms or less), but this is not the usual case for macromolecules.
For this reason, in all cases (but especially in protein crystals) the
amount of experimental data is a crucial aspect.

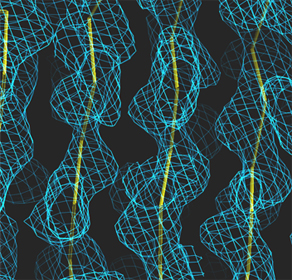 Left: Low
resolution: 5.0
Angström
Right: Medium
resolution: 3.0
Angström
Left: Low
resolution: 5.0
Angström
Right: Medium
resolution: 3.0
Angström
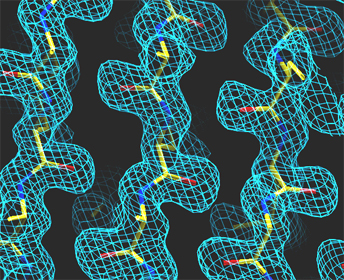 High
resolution: 1.7
Angström
High
resolution: 1.7
Angström
Constructing
a peptide segment on the electron density function obtained using
amplitudes and phases from a diffraction pattern with a resolution of
1.7 Angstrom.
 Effect
of resolution (amount
of experimental data)
Effect
of resolution (amount
of experimental data)
The
movie shows how the electron density map, in a
region of a
protein, changes as the resolution limit is adjusted from 0.5
to 6.0
Å, that is as the contribution of reflexions with the highest
Bragg angles is being omitted. For
this calculation the
phases are perfect and so are the amplitudes (R =
0,0%). Note that, even for a
perfect map (in terms of phases and amplitudes) one expects side chains
to poke out of density at 3.5 Å resolution.
Movie taken from EMBO
Bioinformatics Course.
The effect of amplitudes (intensities)
Similarly, to assess the reliability of a model one has take into
account the effect of the precision
attained for the diffraction amplitudes (intensity
measurements):
 The
importance of amplitudes
(precision
attained by measuring intensities)
The
importance of amplitudes
(precision
attained by measuring intensities)
The
movie above displays the effect of calculating an electron
density map with "wrong" amplitudes. The images in the movie represent
the slow changing of all the amplitudes to a different set of randomly
selected values while phases are kept constant. The gradual change goes
from R=10% (reasonable disagreement) up to R=75% (random amplitudes). It
is interesting to note that the map hardly changes at all until the
R factor gets higher than 50%. The
resolution is 1.5 Å and the phases are always perfect.
Movie taken from EMBO
Bioinformatics Course.
The importance of phases
Finally, it should be noted that the parameter which most
affects the reliability of a structural model is the correctness of the
phases assigned to the diffraction amplitudes, as shown by the
following movie.
 The
effect of phases
(errors in the phases)
The
effect of phases
(errors in the phases)
The
movie displays the effect of calculating a map with "wrong" phases.
The "figure of merit" (the cosine of the phases error) is displayed as
"m". The images are calculated by merging a perfectly calculated map
with
another map, calculated with the same amplitudes, but using phases
obtained from a model with randomly positioned atoms. By merging these
two maps amplitudes are always preserved but the phases change
slowly. The resolution is 1.5 Å and
the R-factor is always 0.0%. It
is important to note the strong dependence between the correctness
of
the phases and the accuracy of the map in order to recognize the atomic
positions.
Movie taken from EMBO
Bioinformatics Course.
But let's go back...


